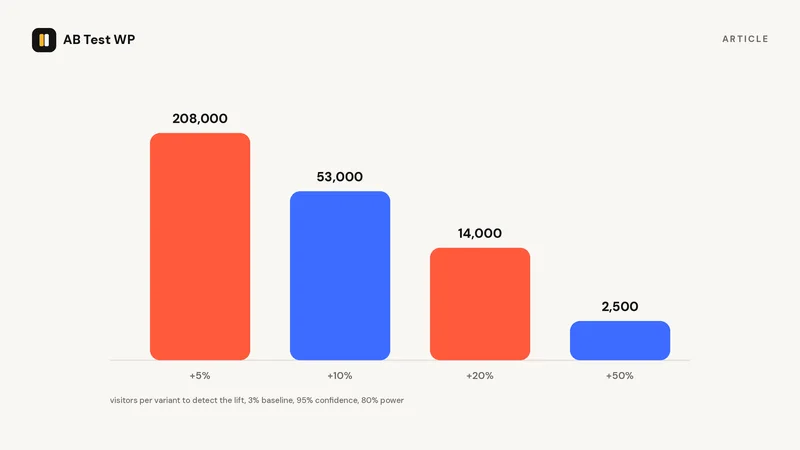
The short answer: for a typical page converting at 3%, detecting a 20% improvement takes about 28,000 visitors split across two variants. For a page converting at 1%, the same test needs over 85,000. And if you are hoping to spot a 10% improvement rather than 20%, multiply those numbers by roughly four.
Those figures surprise most people running their first test, and the surprise is the point of this article. A/B testing is a counting exercise, and the count is set by statistics, not by how confident you feel. Once you understand the three inputs that drive it, you can decide in five minutes whether a test is worth running at all.
The three inputs
Every sample-size calculation, in every tool, comes down to the same three numbers:
- Your baseline conversion rate. What the page does today. A signup form converting 8% of visitors needs far less traffic to test than a checkout converting 1.5%, because rare events are noisier and need more observations to measure.
- The minimum improvement you want to detect. Called the minimum detectable effect, or MDE. This is the smallest lift you would actually act on. It is the input people get wrong most often, because they leave it at a default instead of asking what change would be worth shipping.
- How sure you want to be. Two settings: confidence (usually 95%, meaning a 5% chance of calling a winner when there is none) and power (usually 80%, meaning an 80% chance of catching a real effect of the size you specified). These are conventions, not laws, but they are the conventions everyone else uses, so results are comparable.
Change any one of these and the required sample moves. The relationship is not gentle: sample size scales with the square of the effect you want to detect. Halve the MDE and you need about four times the visitors. That single fact explains most failed tests.
The lookup table
Visitors needed per variant at 95% confidence and 80% power. Double each figure for the total across A and B.
| Baseline rate | Detect +10% | Detect +20% | Detect +30% | Detect +50% |
|---|---|---|---|---|
| 1% | 163,100 | 42,700 | 19,800 | 7,750 |
| 2% | 80,700 | 21,100 | 9,800 | 3,830 |
| 3% | 53,200 | 13,900 | 6,450 | 2,520 |
| 5% | 31,200 | 8,160 | 3,780 | 1,470 |
| 10% | 14,750 | 3,840 | 1,770 | 690 |
| 20% | 6,510 | 1,680 | 770 | 290 |
Read it left to right and the lesson is obvious: on a low-converting page, only large effects are detectable with realistic traffic. Read it top to bottom and you see why testing high-conversion steps, such as a newsletter form or an add-to-cart button, is so much cheaper than testing the final purchase.
The figures come from the standard two-proportion z-test formula, which is what our sample-size calculator runs. Plug in your own baseline and MDE and it returns the visitor count and, given your daily traffic, the number of days.
From visitors to days
The table gives visitors; you have days. The conversion is division, with one rule attached.
Take the 3% page detecting a 20% lift: 13,900 per variant, 27,800 in total. If that page gets 500 visitors a day, the test needs 56 days. At 2,000 a day it needs 14. That is visitors to the tested page, not to the site, which is why the homepage and the most-visited landing pages are where most sites can test at all.
The rule: run for whole weeks even if you reach the number sooner. Weekday and weekend visitors behave differently, and a test that captures four Mondays and two Saturdays is measuring a mix your real traffic never has. One full week is the floor; two are better. The how long to run a test guide covers the timing side in depth.
The quick way
Baseline rate, the smallest lift worth shipping, and daily visitors to the page. Put those three into the calculator before you build anything. If the answer is more than six to eight weeks, change the test, not the maths.
Why "just run it until it looks significant" fails
The tempting alternative is to skip the calculation and watch the results until one variant pulls ahead. It feels empirical. It produces false winners at a rate that would shock you.
Here is the mechanism. Early in a test, with a few hundred visitors, the conversion rates of A and B swing wildly by pure chance. A confidence figure calculated on that data will cross 95% briefly and often, in both directions. If you stop the first time it does, you are not selecting the better variant, you are selecting the moment the noise happened to favour one. Simulations of this "peeking" behaviour show false-positive rates several times the 5% you thought you were accepting. The post on results that did not hold up walks through exactly how that happens.
Deciding the sample size first is the cure. You commit to a number, you run to that number, you read the result once. The confidence figure only means what it claims to mean when you use it that way.
What to do when you do not have the traffic
Most WordPress sites do not have 28,000 visitors a month to a single page. That does not rule out testing; it changes what you test.
Test bigger changes
The table is your guide. If you can only reach the "+50%" column, test things capable of a 50% lift: a different offer, a rewritten hero, a page with one call to action instead of four, a checkout with two fields removed. Small copy tweaks are for sites with traffic to burn.
Test higher up the funnel
A click on the primary button converts at 10-20% on many pages, versus 1-3% for a purchase. The same visitors produce ten times the conversions, and the required sample drops accordingly. Test the click, confirm the purchase rate did not fall, and you have learned most of what a purchase-goal test would have told you in a fraction of the time.
Pool traffic across pages
If the element is the same across many pages, such as a sitewide header button or a product-page template, a test that spans them all reaches the sample far sooner than one page alone. Check that your tool supports it; not all do. In AB Test WP the pooling is free: an element test runs on every page where its class appears, so one test spans them all automatically. Pro adds page targeting, which narrows a test to only the paths matching a pattern.
Accept a longer run, with limits
Eight weeks is roughly the ceiling before seasonality, marketing campaigns and returning-visitor drift start contaminating the comparison. Beyond that, the two arms are no longer seeing the same population, and the result stops being trustworthy however large the sample.
Do not test at all, sometimes
If a change is obviously right, such as fixing a broken form or removing a step nobody could justify, ship it. Testing is for decisions where reasonable people would disagree and the stakes justify the wait.
A worked example, start to finish
An online course site has a sales page with 1,200 visitors a day and a 2.4% purchase rate. The owner wants to test a shorter page against the current long one.
- Baseline: 2.4%.
- Minimum detectable effect: the owner decides a 15% relative lift, to 2.76%, is the smallest result worth the redesign. Anything less and the long page stays.
- Sample: the calculator returns about 30,400 visitors per variant, 60,900 in total.
- Duration: 60,900 divided by 1,200 is 51 days, rounded up to eight whole weeks.
- Decision before starting: eight weeks is at the limit. The owner raises the MDE to 25% (a lift they would be genuinely delighted by), which drops the sample to roughly 11,500 per variant and the run to three weeks. If the short page cannot deliver 25%, they have decided in advance that it is not worth switching.
Notice that the important work happened before a single visitor was assigned. The test now has a finish line and a decision rule, and the result will mean something whichever way it goes.
Common mistakes with sample size
- Using site-wide traffic instead of page traffic. Only visitors who reach the tested page count.
- Choosing the MDE after seeing results. If you set it to match whatever lift appeared, you have removed the protection it provides.
- Counting sessions when you mean visitors. Most tools assign per visitor, so one person returning five times is one unit, not five.
- Forgetting that more variants need more traffic. Three variants at the same certainty need roughly 50% more total visitors than two, because each pairwise comparison still needs its full sample.
- Ignoring sample ratio mismatch. If you planned a 50/50 split and see 58/42, something is broken and the sample size no longer protects you. The SRM checker tells you whether an imbalance is chance or a bug.
Every calculation on this page is the standard two-proportion z-test at 95% confidence and 80% power. Different tools may show slightly different figures because of rounding or a one-sided versus two-sided test; the differences are small next to the effect of your MDE choice.
Sources
- Sample size calculator, Evan Miller, checked September 2026
- How not to run an A/B test, Evan Miller, checked September 2026
Common questions
How many visitors does an A/B test need?
It depends on your baseline conversion rate and the smallest lift you want to detect. A page converting at 3% needs about 28,000 visitors across two variants to detect a 20% improvement at 95% confidence and 80% power; detecting 10% needs roughly four times that.
Why does a smaller effect need so many more visitors?
Required sample size scales with the square of the effect. Halving the minimum detectable effect roughly quadruples the visitors needed, which is why small copy tweaks are only testable on high-traffic pages.
Can I just run the test until it looks significant?
No. Checking results repeatedly and stopping at the first significant reading inflates the false-positive rate well above the 5% you intended. Decide the sample size first, run to it over whole weeks, and read the result once.
What if my page does not get enough traffic?
Test bigger changes that can produce larger effects, test a higher-frequency action such as a button click instead of a purchase, pool the test across pages that share the element, or accept a longer run of up to about eight weeks.