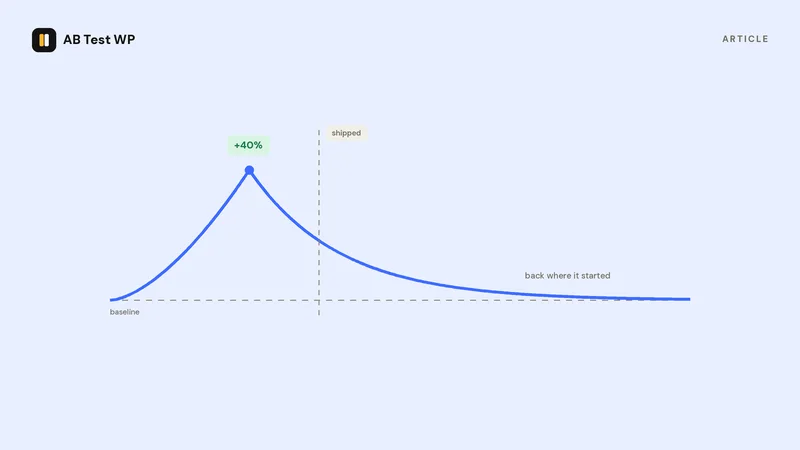
It is one of the most demoralising experiences in optimisation. The tool showed variant B up 40% at 96% confidence. You changed the page. A month later, revenue is flat, or the conversion rate in your analytics looks exactly as it did before. Either the test lied or the world did.
Usually neither. The test measured something real about the visitors it saw, under the conditions it ran in, using the rules you gave it. One of those three things did not carry over to the live site. Below are the six causes, roughly in order of how often they are the culprit, with the tell-tale sign of each.
1. You stopped when it looked significant
The sign: the test ran for days rather than weeks, or you remember checking it and deciding it was "done".
This is the big one. A confidence figure is only valid for a sample size decided in advance and read once. If you watch it as the test runs and stop the first time it crosses 95%, you have changed what the number means. Early in a test, with a few hundred visitors per arm, conversion rates bounce around by chance alone, and the confidence figure crosses your threshold briefly and often. Stopping at one of those crossings selects for noise.
How much does it matter? Run a test with two identical pages and check it every day, stopping at the first "significant" reading, and you will declare a winner far more often than the 5% you thought you were accepting; depending on how often you check and how long you would have run, the false-positive rate climbs to several times that. The 40% lift you saw is exactly the kind of exaggerated early swing this produces, and it shrinks toward zero as the sample grows. It just never got the chance to.
Next time: decide the sample size before starting with the sample-size calculator, run to that number over whole weeks, and read the result once. If you must look mid-test, look at the sample count, not the confidence.
2. The effect was real but much smaller than reported
The sign: the test did reach its planned sample, the lift is genuinely there in production, but it is 8% rather than 40%.
This is the winner's curse, and it happens even to properly run tests. Of all the variants that clear a significance threshold, the ones that clear it are disproportionately the ones whose observed lift landed on the lucky side of their true lift. The threshold is a filter that lets exaggerations through. The smaller your sample relative to the true effect, the larger the exaggeration.
A 40% observed lift on a test that was only powered to detect 20% is a strong hint. The true effect is probably somewhere between them, and your production numbers are telling you where.
Next time: treat the point estimate with suspicion and read the confidence interval instead. If the interval runs from +3% to +77%, "about 40%" was never a fair summary. When a result matters commercially, re-run it, or keep the winner at 100% and compare the following month against the prior one with the seasonal pattern in mind.
3. Novelty wore off
The sign: the variant's advantage was strongest in the first days and faded over the run, and most of your visitors are returning ones.
Regular visitors notice change. A new button, a moved form, a rewritten headline draws attention simply because it is different, and attention converts, for a while. Then the change becomes the normal page and the effect evaporates. The test captured the novelty period; production does not get one.
The reverse also exists. A genuinely better design can lose in the first week because regulars stumble over the unfamiliar layout, then win once they adapt.
Next time: split results by new versus returning visitors if your tool can. If the lift lives entirely in the returning segment, it is probably novelty. Sites with mostly first-time visitors, such as ad landing pages, are largely immune; sites with a loyal audience, such as membership or SaaS dashboards, are the most exposed. Running for at least two full weeks lets the novelty decay show up in the data.
4. The traffic split was broken
The sign: you planned 50/50 and got 55/45, 60/40, or worse.
Sample ratio mismatch. If the assignment was truly random, the split should be within a fraction of a percent of what you set once the numbers are in the thousands. When it is not, something is systematically steering certain visitors into one arm: a caching layer serving one variant more often, a redirect that some browsers follow and others do not, bot traffic concentrating in one version, or a variant that errors for a subset of devices so those visitors never get counted.
The problem is that whatever caused the imbalance also changed who was in each arm. You were no longer comparing like with like, and the lift may belong to the population difference, not the page difference.
Next time: check the split with the SRM checker before you believe any result. A mismatch means investigate and rerun; there is no correction that rescues the data.
5. The test measured a different goal than the one you care about
The sign: the goal was a click and the business metric is a sale, and the two moved differently.
Testing an upstream action is a legitimate way to finish tests faster, and this site recommends it. But a click is a proxy. A variant that makes the button irresistible ("Get it free!" over a paid product) can lift clicks 40% and lift purchases 0%, because the extra clickers were never going to buy. The test was right about clicks. Clicks were the wrong question.
Next time: when you test a proxy, watch the downstream number too, even if it never reaches significance. A click lift with a flat or falling purchase rate is a warning, not a win. And when the variant changes what the button promises, rather than how clearly it promises it, test the purchase directly, or do not trust the proxy.
6. The world changed between the test and the launch
The sign: the test ran in one period and you are judging production in another, with a campaign, a season, a price change or a traffic-source shift in between.
A/B tests compare two variants shown to the same visitors at the same time, and that simultaneity is the whole point. Comparing this month's rate to last month's is a before-and-after study, and before-and-after studies are confounded by everything that happened in between. Your Black Friday traffic, your new ad campaign's cold audience, an algorithm update that changed which pages people land on: any of them can move the baseline more than your variant did, in either direction.
Next time: if you need to confirm a shipped winner, the clean way is another A/B test, shipped winner versus old page, for a short run. The rough way is to compare the same weeks in the prior year, or the period against a page you did not change. And note the calendar in your test log; "won in November" is a different fact from "won".
The pattern behind all six
A test is a controlled comparison under specific conditions. Every failure mode above is a way the conditions in the test differed from the conditions in production: the stopping rule, the sample, the visitors, the split, the goal, or the calendar. Keep those six the same and results hold.
A diagnostic checklist
When a winner does not hold, work through these in order. The first "no" is usually your answer.
- Was the sample size decided before the test started, and reached?
- Did it run at least one full week, ideally two, without edits to either variant?
- Is the observed lift within the range the test was powered to detect, and how wide is the confidence interval?
- Does the lift survive when you look only at new visitors?
- Was the traffic split within a percentage point of plan? (Check it with the SRM checker.)
- Was the goal the business metric, or a proxy for it? Did the business metric move too?
- What else changed between the test window and now?
What a trustworthy result looks like
For contrast, here is a result you can act on with confidence. The sample was planned and reached. The test ran for two full weeks. The split was 50.2/49.8. The lift is 14% with an interval of roughly +5% to +23%. It holds for new visitors and for returning ones. The goal was the action you actually sell, or a proxy whose downstream number moved the same way. Nothing else changed on the site that fortnight.
That result is smaller and less exciting than "+40%". It is also real, and it will still be there next quarter. The statistics explainer covers what the interval and the power figure mean if you want the reasoning behind each step.
Sources
- How not to run an A/B test, Evan Miller, checked September 2026
- Bayesian A/B testing formulas, Evan Miller, checked September 2026
Common questions
Why did my A/B test winner not improve conversions after launch?
Most often the test was stopped when it first looked significant, which selects for random early swings. Other causes are an exaggerated estimate that was real but smaller, a novelty effect among returning visitors, a broken traffic split, a proxy goal that moved without the business metric, or a change in traffic between the test and the launch.
What is the winner's curse in A/B testing?
Among variants that clear a significance threshold, the observed lift is biased upward, because the ones that clear it are disproportionately those whose luck ran in their favour. Read the confidence interval, not the point estimate, and expect production to land lower.
What is a novelty effect?
Returning visitors notice change and interact with it more for a while, which inflates a variant's early results. Split results by new versus returning visitors and run for at least two full weeks to let it decay.
How do I check whether my traffic split was broken?
Compare the visitors per variant with the ratio you set. With thousands of visitors the split should be within a fraction of a percent; a larger gap is sample ratio mismatch and means something steered traffic. An SRM checker tells you whether the gap is chance.