A/B testing statistics exist to answer one question: is the difference I'm seeing real, or just luck? That's it. Every term that scares people away - significance, p-values, confidence, power - is a piece of that single question. This guide explains each one in plain English, shows how they fit together in a worked example, and covers the one mistake (peeking) that quietly ruins more tests than everything else combined.
Updated July 2026
Key takeaways
- A test result is an estimate with noise in it. Statistics exist to tell real differences from coin-flip wobble.
- Significance at 95% means chance alone would produce your gap less than one time in twenty. It does not mean a 95% chance that B is better.
- Sample size and power are set before the test starts. Halve the effect you want to detect and the required sample roughly quadruples.
- Peeking at a running result and stopping on a spike is the most common way to ship a false winner.
Your result is an estimate, not a fact
Flip a fair coin 100 times and you'll rarely get exactly 50 heads - 46 or 55 is perfectly normal. Conversion rates behave the same way. If your page truly converts at 3%, a random 1,000 visitors might show 2.4% or 3.7% without anything having changed. So when variant B shows 3.4% against A's 3.0%, there are two possible explanations: B really is better, or you're looking at coin-flip wobble. The smaller your sample, the bigger the wobble - and everything below is just machinery for telling the two apart.
Statistical significance, in plain English
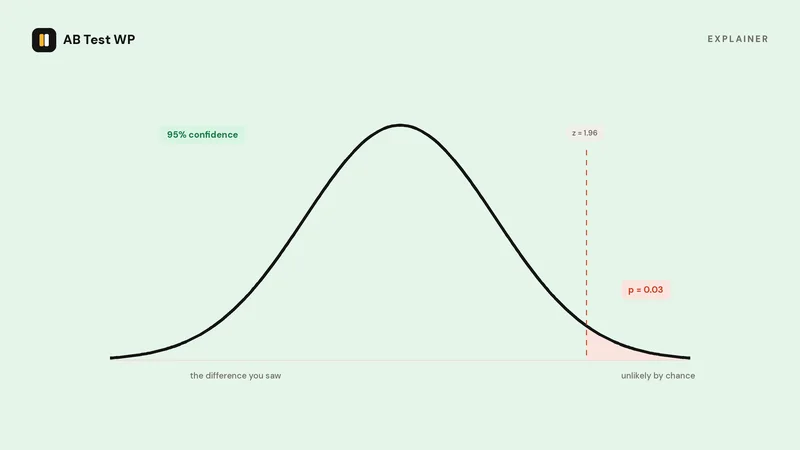
Significance testing starts from a deliberately skeptical assumption: suppose the variants are actually identical. Then it asks: if that were true, how often would random chance alone produce a gap at least as big as the one I'm seeing? That "how often" is the p-value. If chance would produce your gap less than 5% of the time (p < 0.05), the convention is to call the result significant at 95% confidence and treat the difference as real.
Two things significance does not tell you. First, it isn't a guarantee - at 95% confidence, roughly one in twenty tests of a change that does nothing will still come up "significant" by luck. Second, it says nothing about importance: with enough traffic, a meaningless 0.5% relative lift can be statistically significant. Significance answers "is it real?", not "is it worth shipping?"
What 95% confidence does - and doesn't - mean
The most common misreading: "95% confidence means there's a 95% chance B is better." It doesn't. Confidence describes how rarely pure chance would fake your result - it's a statement about noise, not a probability for B. The number people intuitively want - "what's the chance B actually beats A?" - is a different calculation called probability-to-beat, from the Bayesian school of statistics. The two usually point the same way but they are not the same number. (This is why AB Test WP Pro reports both: the two-proportion z-test's confidence and a Bayesian probability-to-beat with an uplift interval - the pair reads more honestly than either alone.)
Power and sample size: decided before you start
Significance protects you from false positives. Power protects you from the opposite miss: a real improvement your test fails to detect because the sample was too small. Power is the probability that, if the effect you care about truly exists, your test will find it - and 80% is the standard target.
Baseline conversion rate, the smallest lift worth detecting, confidence, and power - those four inputs fully determine your required sample size. Feed them into the free sample-size calculator and you get visitors-per-variant and an estimated duration. One shape to internalize: the required sample grows with the square of how small the effect is. Halve the lift you want to detect and you need roughly four times the traffic - which is why low-traffic sites should test bold changes, not button shades.
A worked example with real numbers
Say your page converts at 3%, and the smallest improvement you'd act on is a 20% relative lift - that's 3% → 3.6%, relative not absolute (not 3% → 23%). At 95% confidence and 80% power, the math lands on roughly 13,900 visitors per variant, about 27,800 in total. At 1,000 visitors a day, that's a four-week test. Those are the same defaults the calculator uses, so you can verify the numbers yourself - and when the test finishes, drop the final counts into the significance calculator to see the confidence and uplift the z-test gives them.
The peeking problem
Here's the mistake that undoes everything above: watching the live confidence number and stopping the moment it crosses 95%. Confidence swings wildly early in a test - it will often spike past 95% on noise and drift back down. If you check every day and stop on the first spike, your real false-positive rate isn't 5%; repeated peeking can multiply it several times over. The fix is boring and effective: set the sample size in advance, run for whole weeks so weekday and weekend visitors are both represented, and only judge the result when the planned sample is reached. Our guide on how long to run an A/B test covers the legitimate exceptions (broken variants, skewed traffic splits).
Reading a finished test
At the planned sample size there are only three outcomes, and all three are useful. A significant winner: ship it, write down what you learned, test the next idea. A significant loser: don't ship it - but you just learned something real about your audience, which is the point. Inconclusive: the honest reading is "this change doesn't matter much either way" - keep the simpler version and test something bolder next. If you're new to the full workflow - hypothesis, sizing, building variants, goals - the step-by-step WordPress A/B testing guide walks the whole loop.
The five rules that do 95% of the work
Plan the sample size before launch. Run for whole weeks. Don't act on live numbers mid-test. Judge significance once, at the planned sample. And treat "inconclusive" as a finding, not a failure.
Prefer the statistics handled for you? The free AB Test WP plugin includes the sample-size planner, and Pro runs the z-test, Bayesian probability-to-beat, and sample-ratio checks on your live results automatically. Get notified at launch.
Sources
- How not to run an A/B test, Evan Miller, checked September 2026
- Bayesian A/B testing formulas, Evan Miller, checked September 2026
- Sample size calculator, Evan Miller, checked September 2026